

A growth chart for children helps you, your doctor, and other healthcare professionals keep track of how your baby grows. Boys and girls, infants and older children have different charts.
Growth charts record length, weight and head circumference changes for your baby. On the vertical (up-and-down) axis is the measurement; on the horizontal (side-to-side) axis is the baby’s age.
In your child’s personal health record, there will probably be a growth chart. A birth chart for your baby may also be kept by your child and family health nurse or GP.
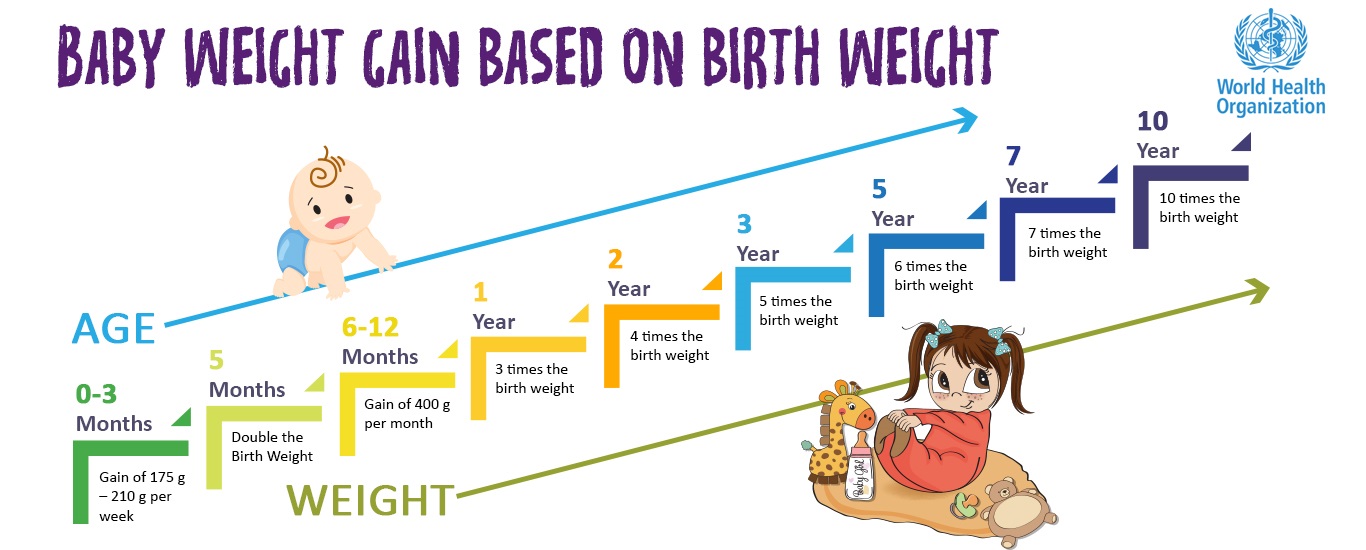
All babies are growing at different rates and there are many ranges of’ normal’ growth. As long as your baby keeps growing, is responsive and healthy, there are usually no need to worry about the growth chart.
What is Growth Chart and how to understand it?
Infant growth charts are generally calculated using the growth standards of the World Health Organization (WHO).
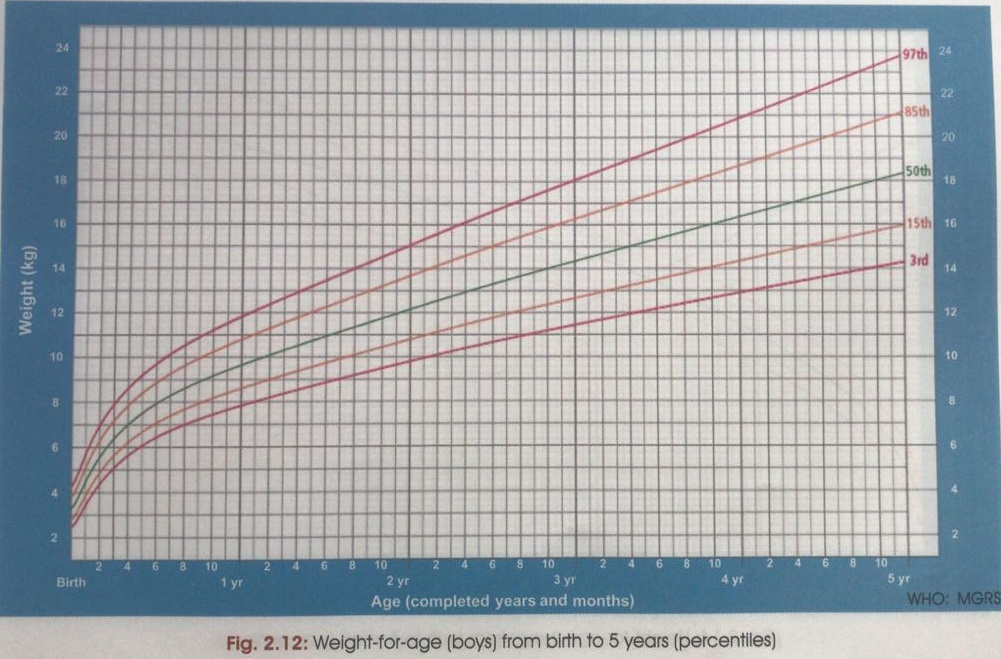


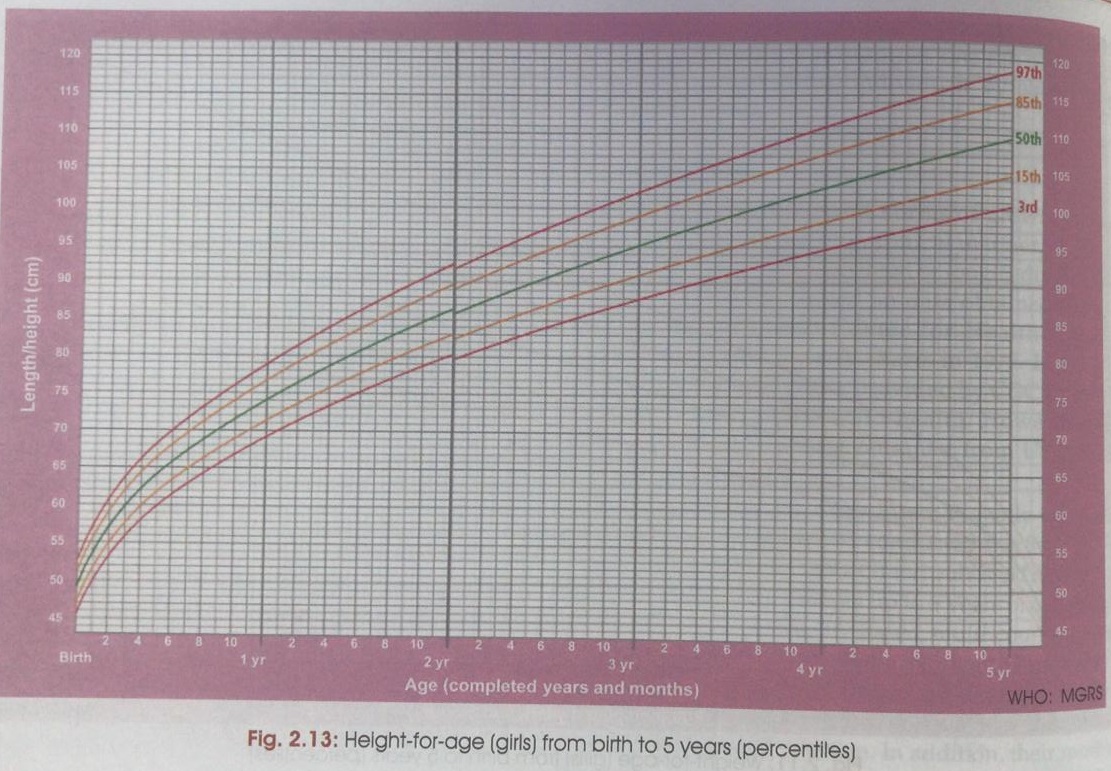
For the first 5 years, these show normal growth in babies.
Child growth charts make it possible for health professionals to compare the growth of your baby with that of all other babies of the same age.
Babies come in all forms and sizes like adults. By using’ percentiles,’ the growth charts show this. For example, a baby weighing on the 50th percentile is right in the middle of the normal range: 50% of babies are lighter in age and 50% are heavier. A baby weighing less than 95 percent of other babies of that age on the 5th percentile.
Some babies are always going to be small and others are going to be big. The important thing is that for their percentile they grow as expected. The charts help you track this by showing normal growth curves (i.e. always increasing). You can plot your baby’s growth to see if it follows a similar pattern to other babies on that percentile.
Watch the below video to know more
https://youtu.be/a_EBrOK_FHk
baby height, baby weight, baby weight and height chart, growth chart